
A new feature in ThinOS 2402 and Wyse Management Suite (WMS) 4.3 is the addition of some great telemetry data on the ThinOS devices. It reports a bunch of info including CPU, memory, storage & network usage along with device network information, connected peripherals, connection broker, currently signed on users, & remote connection info.
In order to get this telemetry data into WMS you need to do the following 2 steps –
- In WMS, Enable Telemetry Dashboard under System Settings\Device Monitoring
- On ThinOS, install the Telemetry Dashboard package, go to dell.com/support, select your thin client model and select Applications, Telemetry Dashboard – current version “ThinOS 2402 (9.5.1079) Telemetry Dashboard v1.0.0.8” here.
The telemetry tab in the WMS dashboard will get populated once enabled in WMS & the package is installed on ThinOS:

It’s an easy 1 button configure to enable the Telemetry data in WMS:

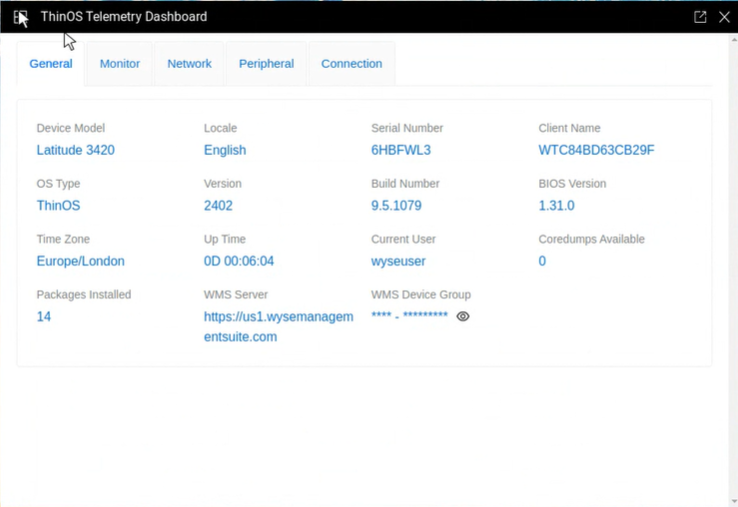
You can also view the Telemetry data locally on the ThinOS device under Troubleshooting\Telemetry Dashboard:

ThinOS Telemetry Dashboard\General tab:
ThinOS Telemetry Dashboard\Monitor tab:

ThinOS Telemetry Dashboard\Network tab:

ThinOS Telemetry Dashboard\Peripheral tab:

ThinOS Telemetry Dashboard\Connection tab:

We continue to innovate in Dell ThinOS and hope you found this helpful! Any questions please let me know!
Additional Resources:
- Community Resources!
Hope you enjoyed!! Let’s connect & subscribe to blog to get latest updates!
-Chris
~~~> Subscribe to blog above to get latest updates!! <~~~
